Visualization of F5 BIG-IP metrics on Grafana using Prometheus and Telemetry Streaming service
This user guide is all about configuration and deployment of telemetry streaming service on F5 BIG-IP device and scraps those metrics by Prometheus which will be finally visualized by the Grafana. One can select the relevant metrics scraped by the Prometheus and visualize them on the Grafana which will be demonstrated later in the guide.
This guide is heavily based on the work performed by
Michael O'Leary and one can view on here. The purpose of this guide is to
document a little more elaborated guide for both learning and deployment
aspects and also address the possible issues that could be faced during the process
of deployment.
Telemetry streaming (TS) is an iControl LX extension
delivered as a TMOS-independent RPM file with the ability to declaratively
aggregate, normalize and forward statistics and events from the BIG-IP to a
consumer application by posting a single TS JSON declaration to TS’s
declarative REST API endpoint. Additional information about Telemetry streaming
can be found on
 |
| Diagram of BIG-IP or API service Gateway |
Reference to the above diagram can be found here.
Prometheus is an open-source monitoring solution that stores time series data like metrics whereas Grafana allows visualizing the data stored in Prometheus and also supports a wide range of other sources.
Architecture diagram used on the deployment
A short briefing about the architecture diagram in
case of this user-deployment case scenario, the F5 BIG-IP system is on
standalone mode with a management IP of 172.20.100.173, and both Prometheus and
Grafana services are running on the same host with an IP address of
192.168.180.191 where the service port for Prometheus is on default – 9090 and
the service port for Grafana is 5000.
The whole deployment guide is broadly divided into the following sections and one can jump to the required step if they have achieved
the previous configuration successfully:
- Section I: Download and install Telemetry Streaming
- Section II: Telemetry Streaming Declaration on the F5 BIG-IP device
- Section III: Configuration of Prometheus
- Section IV: Configuration on Grafana using Prometheus as a data source
Section I: Download and install Telemetry Streaming
We need to first download and install the telemetry
streaming package on the F5 BIG-IP device. Since the telemetry streaming
package is an RPM file that can be downloaded and can install through GUI
or curl command on the CLI of the F5 BIG-IP device.
In this user manual guide, we will download and then
upload the telemetry streaming package on the BIG-IP using the iControl/iApp LX
framework.
At first, we need to download the RPM file, one can
find the latest telemetry streaming RPM file on the F5 Telemetry site on GitHub and
download the latest RPM file.
The GitHub page to download telemetry streaming can be found here.
After downloading the file, you need to access your
F5 BIG-IP GUI with your admin privilege account then follow the following
steps:
Section II: Telemetry Streaming Declaration on the F5 BIG-IP device
Once the download and installation of the F5 telemetry
streaming package have been completed, we need to send a Telemetry Streaming
declaration to configure a Telemetry Streaming pull consumer target.
Before we jump into this configuration, we need to
create a new user with an administrator role on the F5 BIG-IP device and you can
just continue with the default admin user on the further configuration.
We can create a new user in the following steps:
- Go to System > Users > User List
- Click on Create button
- Input the new user’s name and password
- Select role as administrator then add
- Click on the Finished button
As we’re using Prometheus on this user-guide manual
so, the Telemetry Streaming consumer target will be Prometheus which is hosted
on 192.168.180.191:5000
We can either use Postman or using curl command on the CLI of the F5 BIG-IP device to configure a Telemetry Streaming pull consumer
target.
Configuration using Postman application
Just follow the following steps for the configuration
of the telemetry streaming consumer target using the Postman application.
Step I: Open the Postman and create a new tab
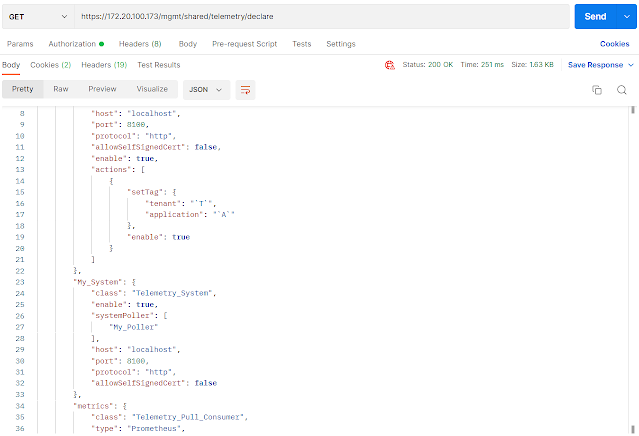
Step II: Select the GET method and paste the following link
https://<big-ip-management-ip-address>/mgmt/shared/telemetry/declare
Step III: Browse on Auth field and fill up the credentials
Use the credentials used to log into F5 BIG-IP (in
this case, recently created new user)
Step IV: Select on Body option
Change the method into POST, then select raw
sub-option and then JSON data format. Past the Telemetry Streaming declaration
on the body section and then click on the send button.
|
{ "class": "Telemetry", "My_Poller": { "class":
"Telemetry_System_Poller", "interval": 0 }, "My_System": { "class":
"Telemetry_System", "enable": "true", "systemPoller": [ "My_Poller" ] }, "metrics": { "class":
"Telemetry_Pull_Consumer", "type":
"Prometheus", "systemPoller":
"My_Poller" } } |
Step V: Verify the response as the success status
Step VI: Verify the available metrics
Create a new tab on Postman:
-
On the URL section
https://<big-ip-management-ip-address>/mgmt/shared/telemetry/pullconsumer/metrics
-
On the authorization section, use the same
credentials used before
You will obtain a response something like this:
Configuration using CLI of F5 BIG-IP device
Following steps for the
configuration of telemetry streaming consumer target using CLI of F5 BIG-IP
device are discussed below:
Once you have accessed your F5 BIG-IP device CLI
terminal then access either your default admin credentials or the new user
you’ve recently created on the above section. Then execute the following
commands on the terminal:
On the username and password section, you either
enter your default admin credentials or the new user you’ve recently created
has the administrator privilege.
|
curl -u username:password -k
https://localhost/mgmt/shared/telemetry/declare
|
Note:
-k, --insecure
to be made secure by using the CA
certificate bundle installed by default. This makes all connections considered
"insecure" fail unless -k, --insecure is used.
ChangChange into tmp directory and
create a file called ts-config.json and I am using vi editor for it.
|
cd /tmp vi ts-config.json
|
Paste the Telemetry Streaming
declaration and then save the file and exit the vi editor.
|
{ "class": "Telemetry", "My_Poller": { "class":
"Telemetry_System_Poller", "interval": 0 }, "My_System": { "class":
"Telemetry_System", "enable": "true", "systemPoller": [ "My_Poller" ] }, "metrics": { "class":
"Telemetry_Pull_Consumer", "type":
"Prometheus", "systemPoller":
"My_Poller" } }
|
Then execute the following
command on the terminal on the same directory /tmp and change the username and
password section with your F5 BIG-IP device credentials having the
administrator privilege.
|
curl -X POST -u
username:password -k https://localhost/mgmt/shared/telemetry/declare -d @ts-config.json -H
“content-type:application/json”
|
To verify the available metrics
|
curl -u username:password -k
https://localhost/mgmt/shared/telemetry/pullconsumer/metrics |
Section III: Configuration of Prometheus
Once the telemetry streaming
service has been successfully configured and the metrics are available on the
path. We need to configure Prometheus in order to scrape the metrics data on
the predefined path. The following are the steps to configure the
Prometheus:
Note: On this user-guide
demonstration, both Grafana and Prometheus are installed on the same host with
different service ports as mentioned earlier. CentOS 7 is used as the OS for this
host machine and you may have different syntax to view the following status
check.
First check the status of the Prometheus
|
sudo systemctl status
prometheus.service |
View the current working directory and change into /etc/prometheus
|
pwd cd /etc/prometheus ls -al |
|
global: scrape_interval: 10s
scrape_configs: - job_name: 'TelemetryStreaming' scrape_timeout: 30s scrape_interval: 30s scheme: https
tls_config: insecure_skip_verify: true
metrics_path:
'/mgmt/shared/telemetry/pullconsumer/metrics' basic_auth: username: 'F5-BIG-IP-username' password: 'F5-BIG-IP-password' static_configs: - targets: ['BIGIP-managementIP:443']
|
Then restart the Prometheus service and check the status of the Prometheus service.
|
sudo systemctl restart
prometheus.service sudo systemctl status
prometheus.service |
Note: If the configuration is
correct, then the Prometheus service will be enabled otherwise, the status of the Prometheus service will be disabled.
To further verify whether instances has been discovered on the the Prometheus:
-
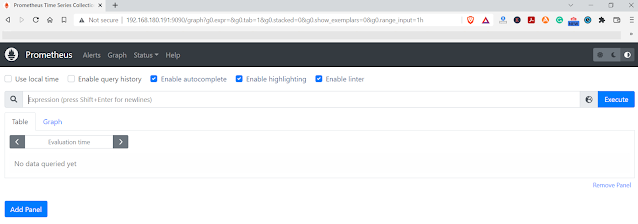
Go to http://prometheus-ip:service/port
-
Click on the Status option and select the Target option
Section IV: Configuration on Grafana using Prometheus as a data source
In this section, we need to connect Prometheus as a data source on Grafana
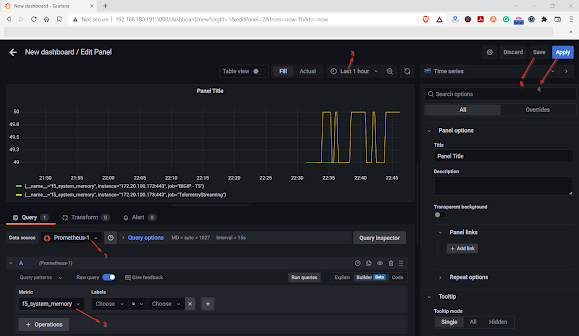
Once the data source has been successfully configured on Grafna then Create a new dashboard and select
Prometheus as the data source then select the relevant metrics and change the
refresh interval as required. Save and apply the panel. Then,

.jpg)


.png)


Post a Comment